Kerala is known for its remarkable performance in indicators of human development. The Human Development Index for India was 0.554 in 2011-12 (the index ranges from 0 to 1, with 1 being the highest level). The Index for Kerala was 0.911 a high value and similar to the performance of many advanced countries. Specifically, Kerala has been way ahead of the national average in respect of the literacy rate (94 per cent), life expectancy at birth (74 years) and infant mortality rate or IMR (13 per thousand live births). The corresponding all-India figures are a literacy rate of 74 per cent, life expectancy of 66 years and IMR of 40. These achievements are undeniably due to effective public action by the State.
What about Kerala’s performance in terms of absolute poverty?
Official estimates based on the consumer expenditure surveys of the National Sample Survey Office (NSSO) show a sharp reduction in absolute poverty over the last 40 years. The incidence of absolute poverty or the head count ratio (HCR) in Kerala fell from 59.8 per cent in 1973-74 to 25.4 per cent in 1993-94 and further to 7.1 per cent in 2011-12 (Table 1). In absolute terms, 15.5 lakh rural persons and 8.5 lakh urban persons were below the official poverty line in 2011-12.
| Years | ||||||
|---|---|---|---|---|---|---|
| 1973-74 | ||||||
| 1977-78 | ||||||
| 1983 | ||||||
| 1987-88 | ||||||
| 1993-94 | ||||||
| 1999-00 | ||||||
| 2004-05 | ||||||
| 2009-10 | ||||||
| 2011-12 | ||||||
| Years | ||||||
| 2009-10 | ||||||
| 2011-12 | ||||||
The incidence of absolute poverty in Kerala was much lower than the national average. In 2011-12, in rural areas, the HCR was 9.1 per cent in Kerala and 25.7 per cent at the all-India level. In urban areas, the HCR was 5 per cent in Kerala and 13.7 per cent at the all-India level.
An interesting feature of the official poverty estimates is that with the change in methodology, and use of the Tendulkar poverty line in 2011-12 (the change made was that the urban poverty line was applied to rural areas as well), there was an increase in rural poverty relative to urban poverty in Kerala. As Table 1 shows, the urban HCR was higher than the rural HCR in most years in Kerala, but this was reversed in 2011-12. However, if the alternative Rangarajan methodology is used, the picture is again reversed, with the rural HCR (7.3 per cent) becoming lower than the urban HCR (15.3 per cent). In other words, the incidence of urban poverty again becomes higher than the incidence of rural poverty.
I have used the unit level data of the NSSO Consumer Expenditure Survey (CES) of 2011-12 to further disaggregate poverty estimates across social groups and occupations.
The NSSO has a four-fold classification of sample households in terms of social groups: Scheduled Tribes (ST), Scheduled Castes (SC), Other Backward Classes (OBC) and Others. My calculation shows that the HCR was highest among Scheduled Tribes (39.4), followed by SCs (16 per cent), OBCs (7.1 per cent) and, finally, Others (5.8 per cent). The problem of poverty was acute among Scheduled Tribes in rural areas. In rural Kerala, the HCR among STs was 41 per cent (the corresponding all-India figure was 45.3 per cent). In urban areas, the HCR among STs was 13.6 per cent as compared to the national average of 24.1 per cent. A word of caution is needed here, as the sample size for 2011-12 for Scheduled Tribe households in Kerala was less than 40.
| Region | ||||
|---|---|---|---|---|
| Kerala | ||||
| India | ||||
| Region | ||||
| Kerala | ||||
| India | ||||
| Region | ||||
| Kerala | ||||
| India | ||||
I also disaggregated estimates of poverty by source of income of the household. In the CES, sample households are classified into occupation groups based on the single major source of their income from economic activities during the previous 365 days. For rural areas, the categories are: self employed in agriculture, self employed in non-agriculture, regular wage/ salary earnings, casual labour in agriculture, casual labour in non-agriculture and others. In case of urban households, the categories are: self employed, regular wage/salary earnings, casual labour and others.
The HCR was highest among “casual labour in agriculture” households in rural Kerala (25 per cent), followed by “casual labour in non-agriculture.” By contrast, at the all India level, the HCR was highest among “casual labour in agriculture” followed by “self employed in agriculture.” In urban areas of Kerala, the HCR was highest among “casual labour” households (10.7 per cent), followed by “others.” We need more information on what constitutes the category of “others” in rural Kerala. In urban India, the HCR was highest among “casual labour” followed by “self employed.” There are thus some differences as between Kerala and India in respect of occupation-based groups with a high incidence of poverty.
To sum up, the incidence of absolute poverty in Kerala is much lower than the national average and has declined steadily over the years. The numbers of absolute poor are not large, and the Government of Kerala can end absolute poverty during the Thirteenth Five Year Plan. However, when estimates of poverty are disaggregated by social group, in both rural and urban areas, then for every social group other than rural Scheduled Tribes, the HCR in Kerala is much lower than in the rest of India. Although the head count ratio for rural Scheduled Tribes in Kerala was lower than in India as a whole, the gap was not as great as in the case of other social groups. To put it another way, the incidence of absolute poverty among rural Scheduled Tribes is high in Kerala and only a little lower than the national average. Lastly, in terms of occupational groups, it is clear that the incidence of poverty is highest among households dependent on casual labour in rural and urban areas of Kerala. Poverty alleviation requires measures to provide better employment and livelihood opportunities to casual labour households.
This note draws on the calculations I made for the working group on Poverty Reduction, Livelihood and Natural Resource Management for the formulation of Thirteenth Five Year Plan (2017-2022) in Kerala under the guidance of Professor Madhura Swaminathan.
References
National Sample Survey Office (NSSO) (2013), Household Consumer Expenditure in India, National Sample Survey 68th Round (July 2011-June 2012), National Sample Survey Office, Ministry of Statistics and Programme Implementation.
Planning Commission (2014), Report of the Expert Group to Review the Methodology for Measurement of Poverty, Government of India, New Delhi.


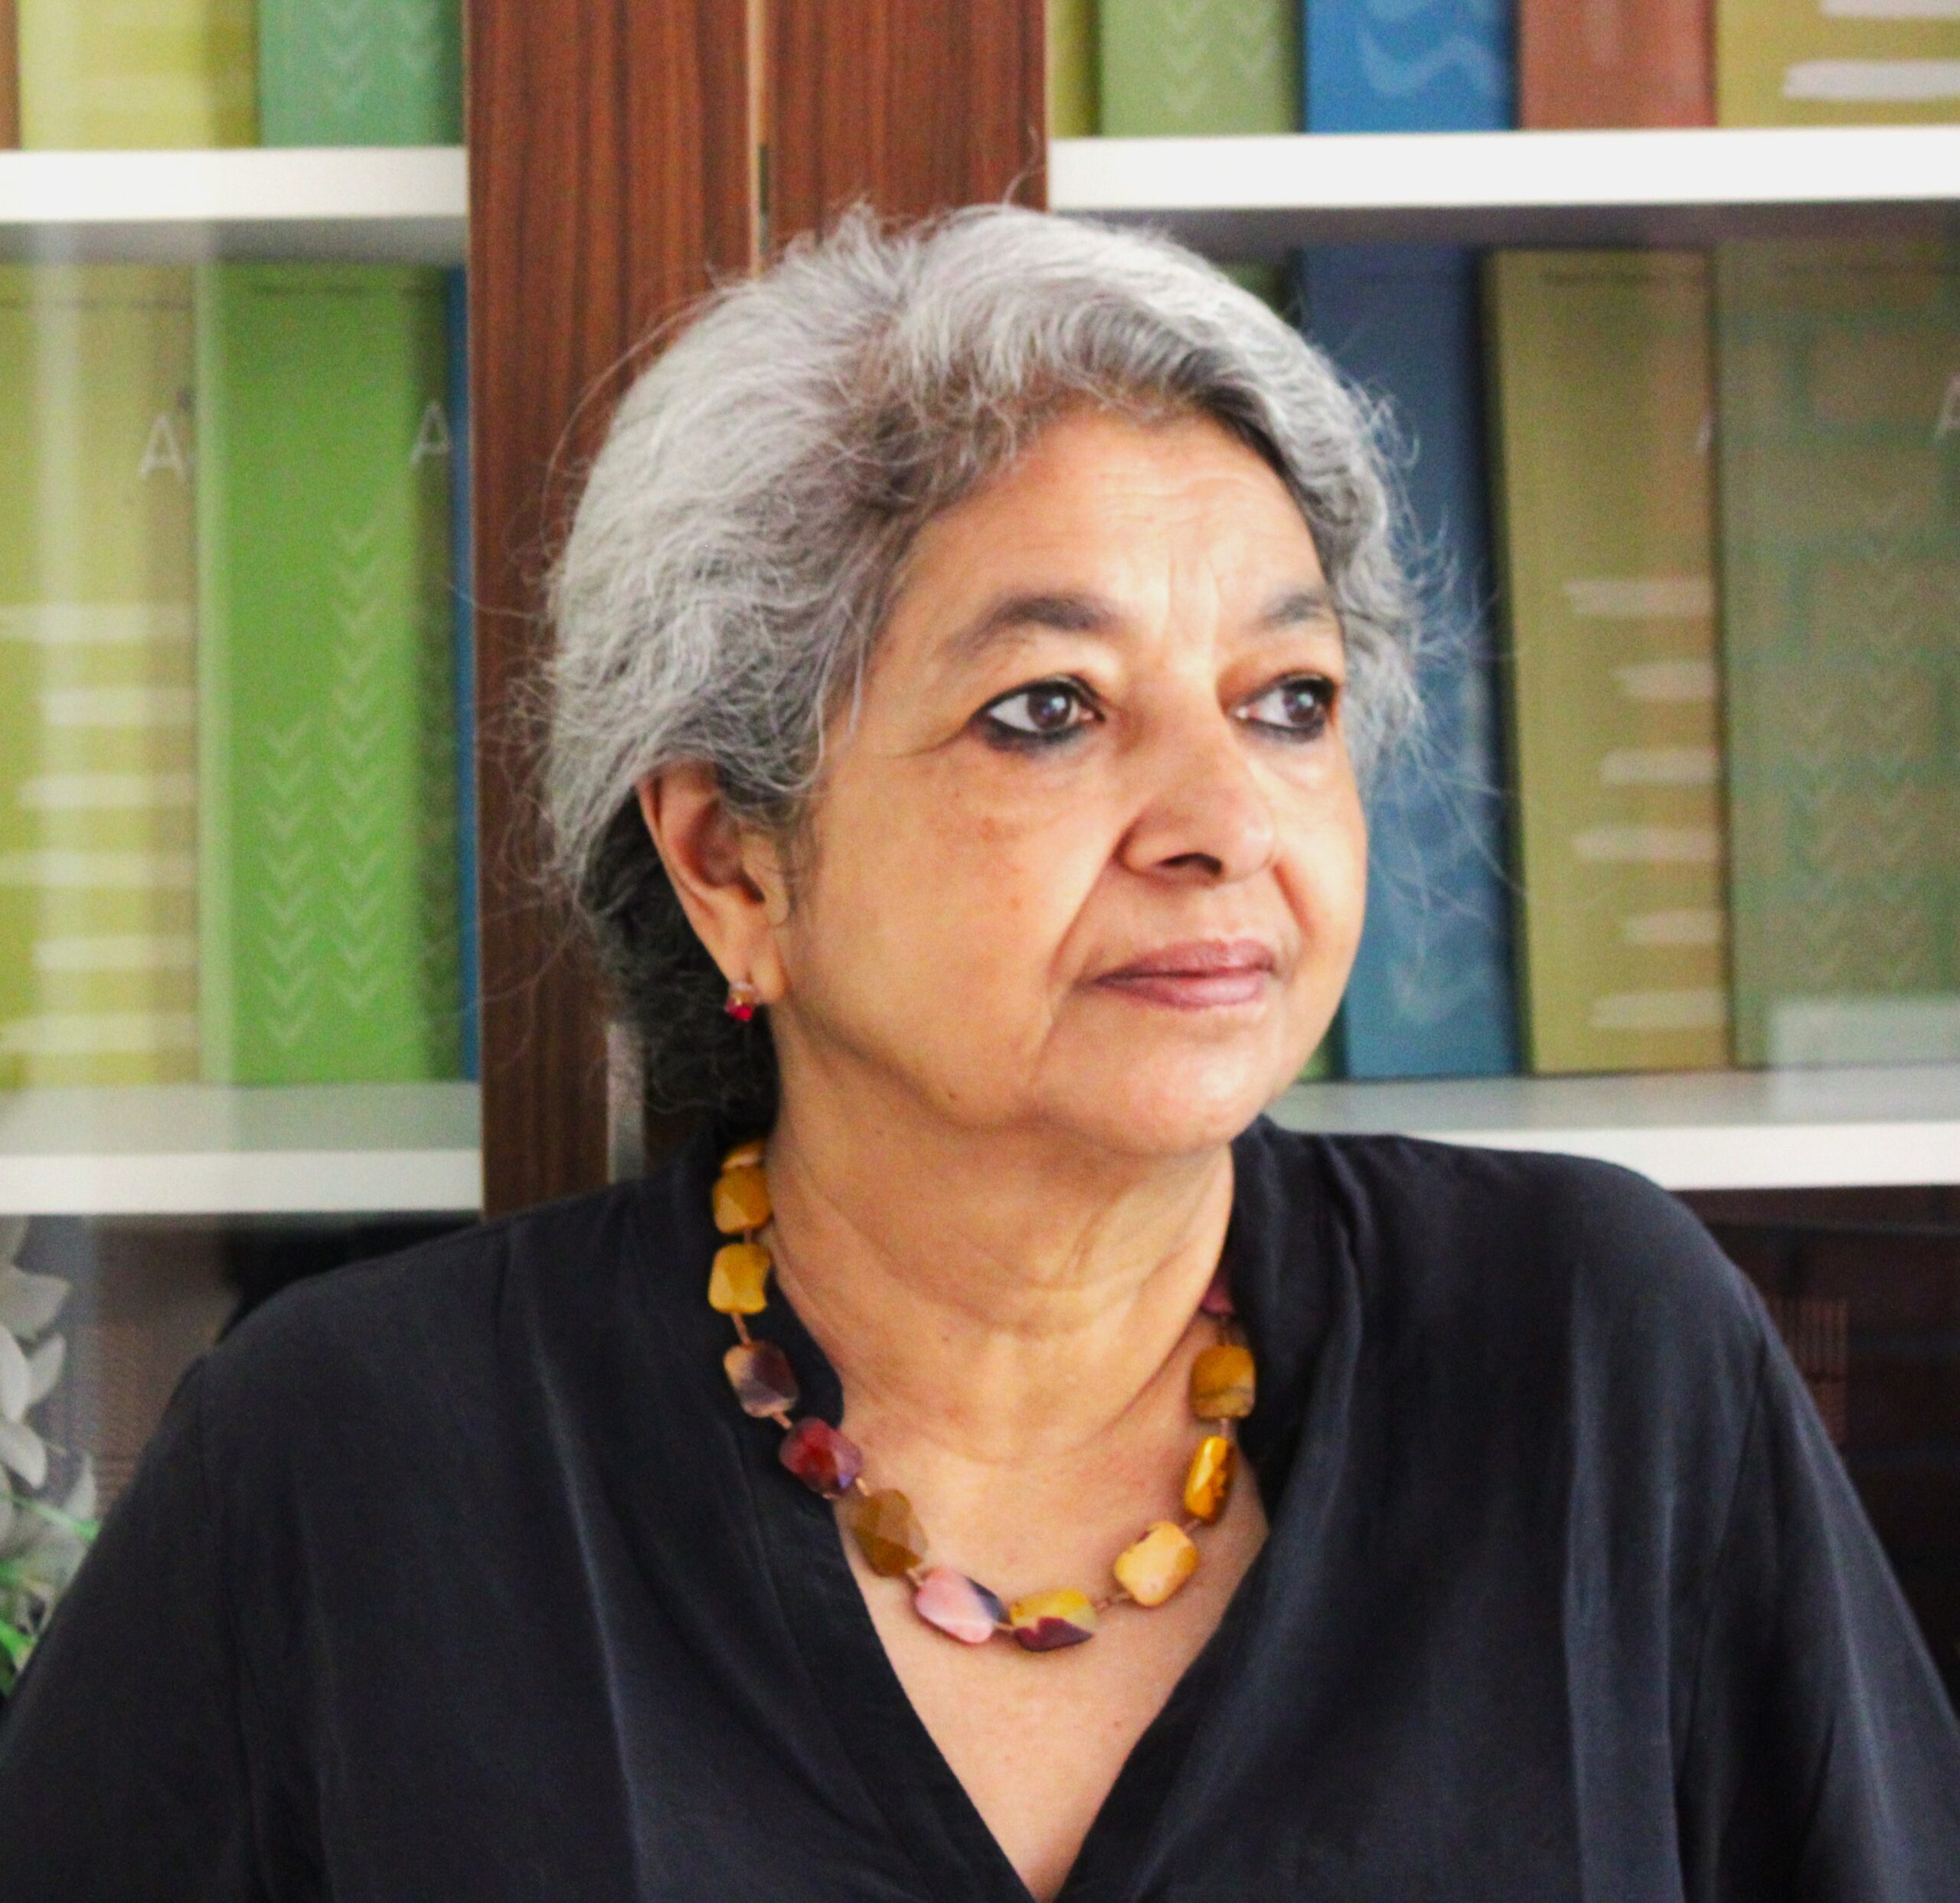




 Sudha is an Administrative Assistant of the Foundation. She assists the administrative division of the Foundation and also has taken part in fieldwork organised by the Foundation.


