A few days into the farmer’s agitation in India, a video episode of the programme “Cut the Clutter” hosted by journalist Shekhar Gupta was circulating in the social media. Those who criticised the farmer’s agitation were seen sharing the video episode to argue out the merits of the three Farm Acts passed by the central government in September 2020. The episode is here.
This episode is an excellent example of selectively using data to push a partisan point. Gupta says that the arguments against the Farm Acts are “BS”. The key point hammered in by Gupta is that Bihar is a success story of Agricultural Produce Marketing Committee (APMC) reforms in India. For this purpose, he compares agricultural growth rates in Bihar and Punjab. According to him, after Bihar annulled its APMC Act in 2006, its agricultural growth rate increased, and even surpassed the agricultural growth rate of Punjab. He cites a paper authored by Ashok Gulati et al. from where he picks up these growth data between 2005-06 to 2014-15.
Such a startling claim led one to look at the data on agricultural growth rates. I first considered data for Gross State Value Added (GSVA) from agriculture at constant prices (base year 2004-05 = 100). It turns out that between 2006-07 and 2011-12, Bihar’s GSVA from agriculture grew at 4.8 per cent per year, while Punjab’s GSVA from agriculture grew at about 1 per cent. This is indeed accurate. However, this is an incomplete story. If Bihar’s APMC reforms indeed worked wonders for the State, we should see the same results replicated in longer time series also.
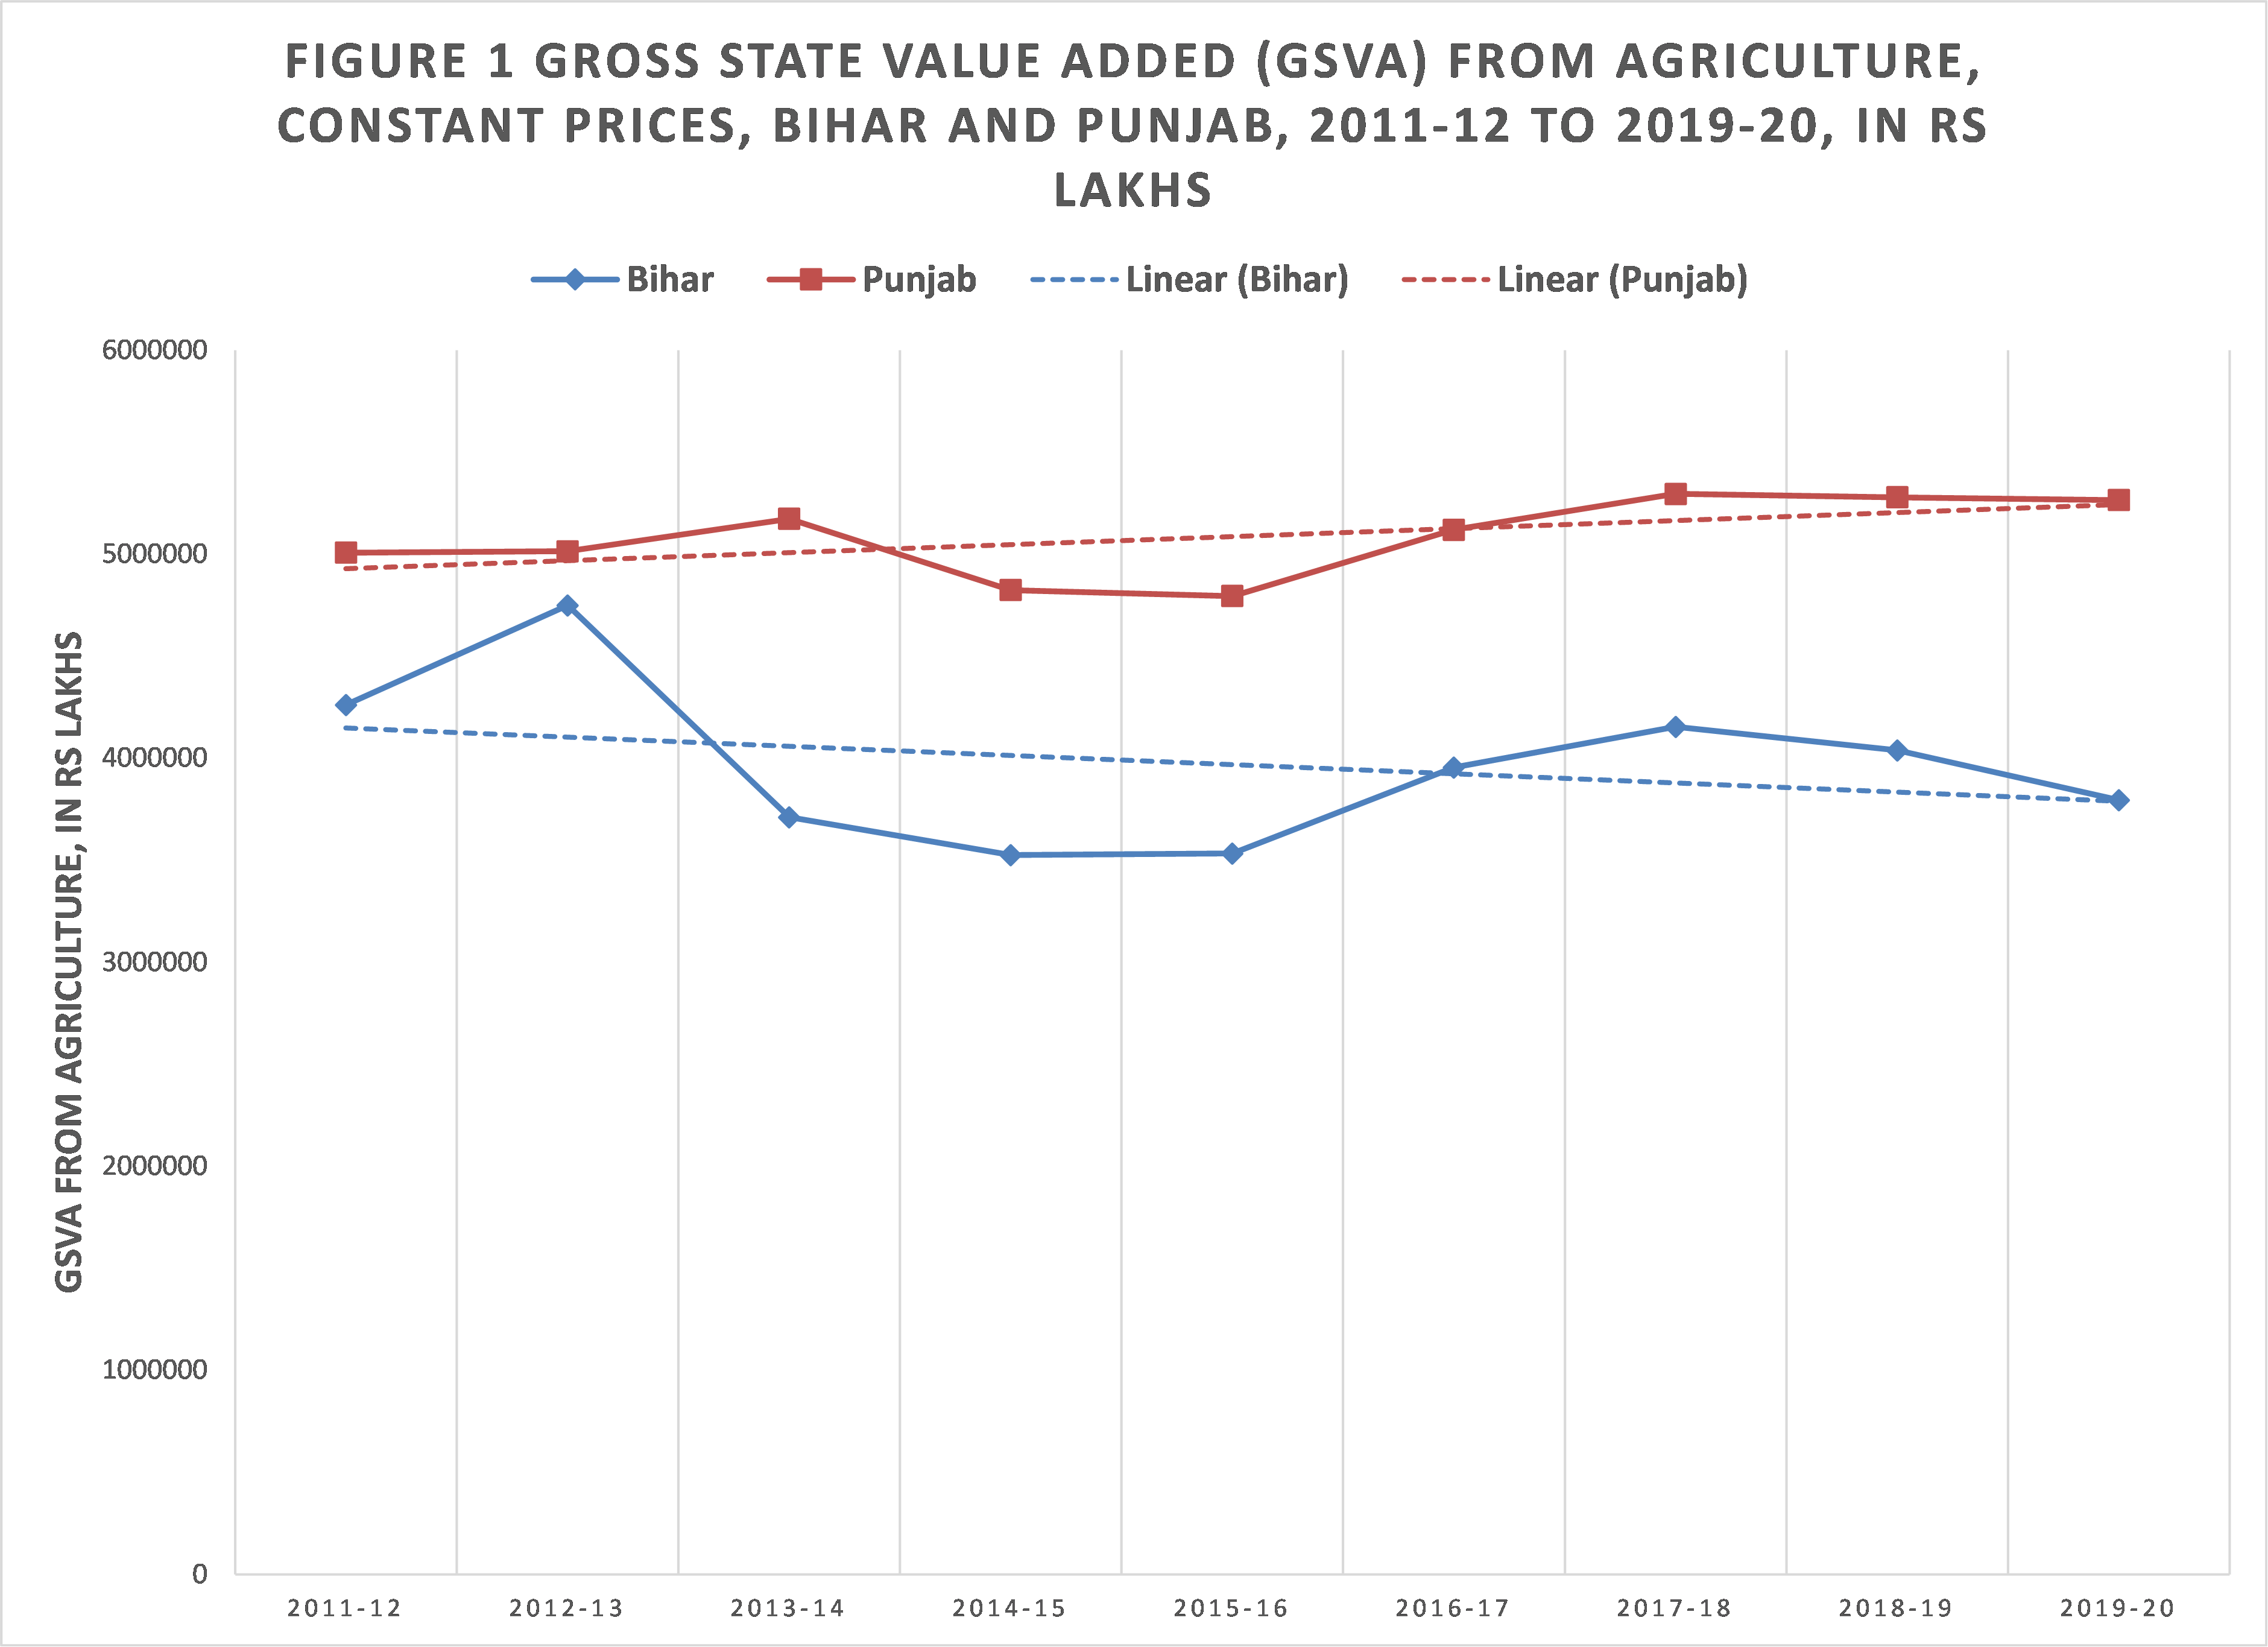
Thus, I considered the new series of GSVA from agriculture at constant prices (base year 2011-12 = 100) between 2011-12 to 2019-20. In this period, Bihar’s agriculture grew at (-)1 per cent per year, while Punjab’s agriculture grew at about (+)1 per cent per year (see Figure 1). In other words, Bihar’s agricultural GSVA shrank in absolute terms, while Punjab’s agricultural GSVA kept growing.
Why did Bihar’s agricultural GSVA shrink after 2011-12 if its APMC reforms were a success? Did the “Nitish Kumar magic”, to use Gupta’s words, disappear into thin air? And why did Punjab’s agricultural GSVA continue to rise at a positive rate in the same period?
In a national comparison also, Bihar fares poorly. I considered data on Value of Output (VOO) from all “crops” at 2011-12 prices between 2011-12 and 2017-18. In this period, the VOO of crops in Bihar grew at 0.9 per cent per year, while VOO of crops in India as a whole grew at 1.5 per cent per year.
While Gupta celebrates the first set of growth rates, he is silent on the second and third sets of growth rates cited above.
In all these comparisons, we should remember the fact that Bihar’s numbers were far lower in levels compared to Punjab’s numbers. In 2012-13, the value of output per hectare was Rs 35,825 in Bihar and Rs 78,652 in Punjab. In the same year, the average monthly income from cultivation per agricultural household was Rs 1715 in Bihar and Rs 10,862 in Punjab. In other words, a short stretch of high growth is hardly adequate to punch Bihar ahead of Punjab in agricultural incomes. Further, a negative growth rate in Bihar after 2011-12, over a low base, is a sign of crisis, not promise.
The selective use of data to push neoliberal standpoints has been a mark of commentaries that have attacked the ongoing farmer’s agitation (see for example, another instance at “Per hectare farm income: Does Bihar really outshine Punjab? by R. Ramakumar and Ashish Kamra, Financial Express, 25 November 2020, available here). Poor empirical basis for policy changes can end up being disastrous for the recipients of the policy. That is exactly what has transpired with agricultural policy over the past 25-30 years. Gupta would do well to remember this.
