Over the last two decades, there has been widespread and growing concern about agrarian distress and the level and variability of farmers’ incomes. In the most recent Union Budget, the Finance Minister said that Agriculture and Farmers’ Welfare was the first of the nine pillars of the transformation agenda of the government, and the aim of government policy was to double farmers’ income in five years (by 2022). To address the problem of agrarian distress and to monitor the goal of doubling farmer’s incomes, the first requirement is of accurate data on farmers’ incomes over time.
In India, surprisingly enough, we did not have any official data on incomes of farm households till a decade ago. The first official source of data on farmer’s incomes was the Situation Assessment Survey (SAS) conducted by the National Sample Survey Organisation in 2003, and repeated in 2013. The obvious first exercise would be to look at changes in income over the decade 2003-13. Unfortunately, such an exercise is not feasible. This is because SAS 2003 and SAS 2013 differ in (a) the definition of a farmer, (b) the sampling size and strategy, and (c) the concept of income. I shall deal with (a) and (c) in this note, drawing on the doctoral work of Biplab Sarkar. [On (b), the sampling strategy and its implications for underestimation of large land owners, see Kumar (2016, forthcoming).]

On definitions
By the definition used in 2003, “a farmer was understood as a person who possessed some land and was engaged in agricultural activities on any part of that land during the 365 days preceding the date of survey.” A farmer household was defined as one which had at least one farmer. Agricultural activity was taken to include “cultivation of field and horticultural crops, growing of trees or plants such as rubber, cashew, coconut, pepper, coffee, tea, etc; animal husbandry, fishery, bee-keeping, vermiculture, sericulture, etc.”(NSSO 2005)
In 2013, the term “farmer household” was changed to “agricultural household.” “An agricultural household for this survey was defined as a household receiving some value of produce more than Rs.3000 from agricultural activities (e.g., cultivation of field crops, horticultural crops, fodder crops, plantation, animal husbandry, poultry, fishery, piggery, bee-keeping, vermiculture, sericulture etc.) and having at least one member self-employed in agriculture either in the principal status or in subsidiary status during the last 365 days.” (NSSO 2014)
Thus, the definition of a farmer or agricultural household shifted away from one based on land ownership (and employment) to one based on a minimum level of income from agricultural activity (and employment). Even though the 2013 definition may be better at capturing those actually engaged in agricultural activities, a simple comparison of results from the two surveys makes no sense. A careful empirical exercise will have to be undertaken to assess the overlap between households using these two alternative definitions.
On cost concepts
Agriculture is a business, a risky business. As with other businesses, income from agriculture has to be calculated as gross income (say from value of output) net of the costs incurred. The definition of costs is thus critical for the estimation of incomes from agriculture. Here too, SAS 2003 and SAS 2013 differ in the way costs are measured. And both differ from the standard cost concepts used by the Commission on Agricultural Costs and Prices (CACP), the organisation assigned the task of calculating costs and proposing minimum support prices for a range of crops.
In SAS 2003, the cost items for which data were collected include material inputs (home-produced and purchased), hired labour, maintenance costs, rent paid on leased-in land, interest paid on crop loans and other costs.
In SAS 2013, data were collected only on out-of-pocket expenses. In other words, only purchased material inputs were included, not home-produced material inputs. In cases where the application of home-grown manure is important or where farmers use their own seeds, there will be an underestimation of costs of cultivation in 2013 as compared to 2003.
Furthermore, neither survey captures some components of costs that are included in the CACP methodology, such as family labour, the imputed costs of owned land, interest on own fixed capital, maintenance costs of own bullock labour, and so on.
The crucial point here, as Sarkar (2016) points out, is the difference between economic costs and accounting costs. Accounting costs correspond to actual expenses (whether in cash or kind). Economic costs refer to opportunity costs and therefore include implicit costs of inputs as well as explicit out-of-pocket expenses. For example, the opportunity cost of a day of labour provided by a family member on the farm is, say, the wage the same person could have earned if employed elsewhere. Worldwide, the use of economic costs is recommended. SAS 2003 and SAS 2013 have not followed this principle.
Excluding economic costs is likely to underestimate total costs. A quick comparison of the costs of production of paddy from SAS 2003 and CACP for 2002-3 show that the SAS estimate of costs is lower in all States (Sarkar 2016). To illustrate, in West Bengal, the CACP reports the cost of production of paddy per hectare to be Rs 15,790 whereas SAS 2003 estimates it to be Rs 12,380. This suggests that SAS 2003 has over-estimated the net income from paddy production.
Conclusion
In India, we have only one source of official data on farmer’s incomes, namely the Situation Assessment Survey (SAS) conducted by the National Sample Survey Organisation. The Survey has been conducted twice, once in 2003 and again in 2013. SAS 2003 and SAS 2013 differ in the the way they define the term “farmer,”and in the sampling methodology and cost concept used, making an analysis of change in farmers’ incomes very difficult. Further, both surveys fail to take account of the economic costs of cultivation, and are thus likely to underestimate true costs, and correspondingly, overestimate net incomes from farming.
If we are serious about understanding and addressing agrarian distress, we first need to get our statistics on farmers’ incomes right.
References
Kumar, Deepak (2016, forthcoming), “The Underestimation of the Extent of Operational Holdings of Land in India,” Review of Agrarian Studies, vol. 6, no.1.
National Sample Survey Office (NSSO), 2005,Situation Assessment Survey of Farmers: Some Aspects of Farming, NSS 59th Round, Jan-Dec 2003, Government of India, New Delhi.
National Sample Survey Office (NSSO), 2014, Key Indicators of Situation of Agricultural Households in India, NSS 70th Round, Jan-Dec 2013, Government of India, New Delhi.
Sarkar, Biplab, 2016, “Official Statistics on Income from Crop Production: A Critique,” chapter of doctoral thesis (unpublished), ms., Indian Statistical Institute, Bangalore.
About the author
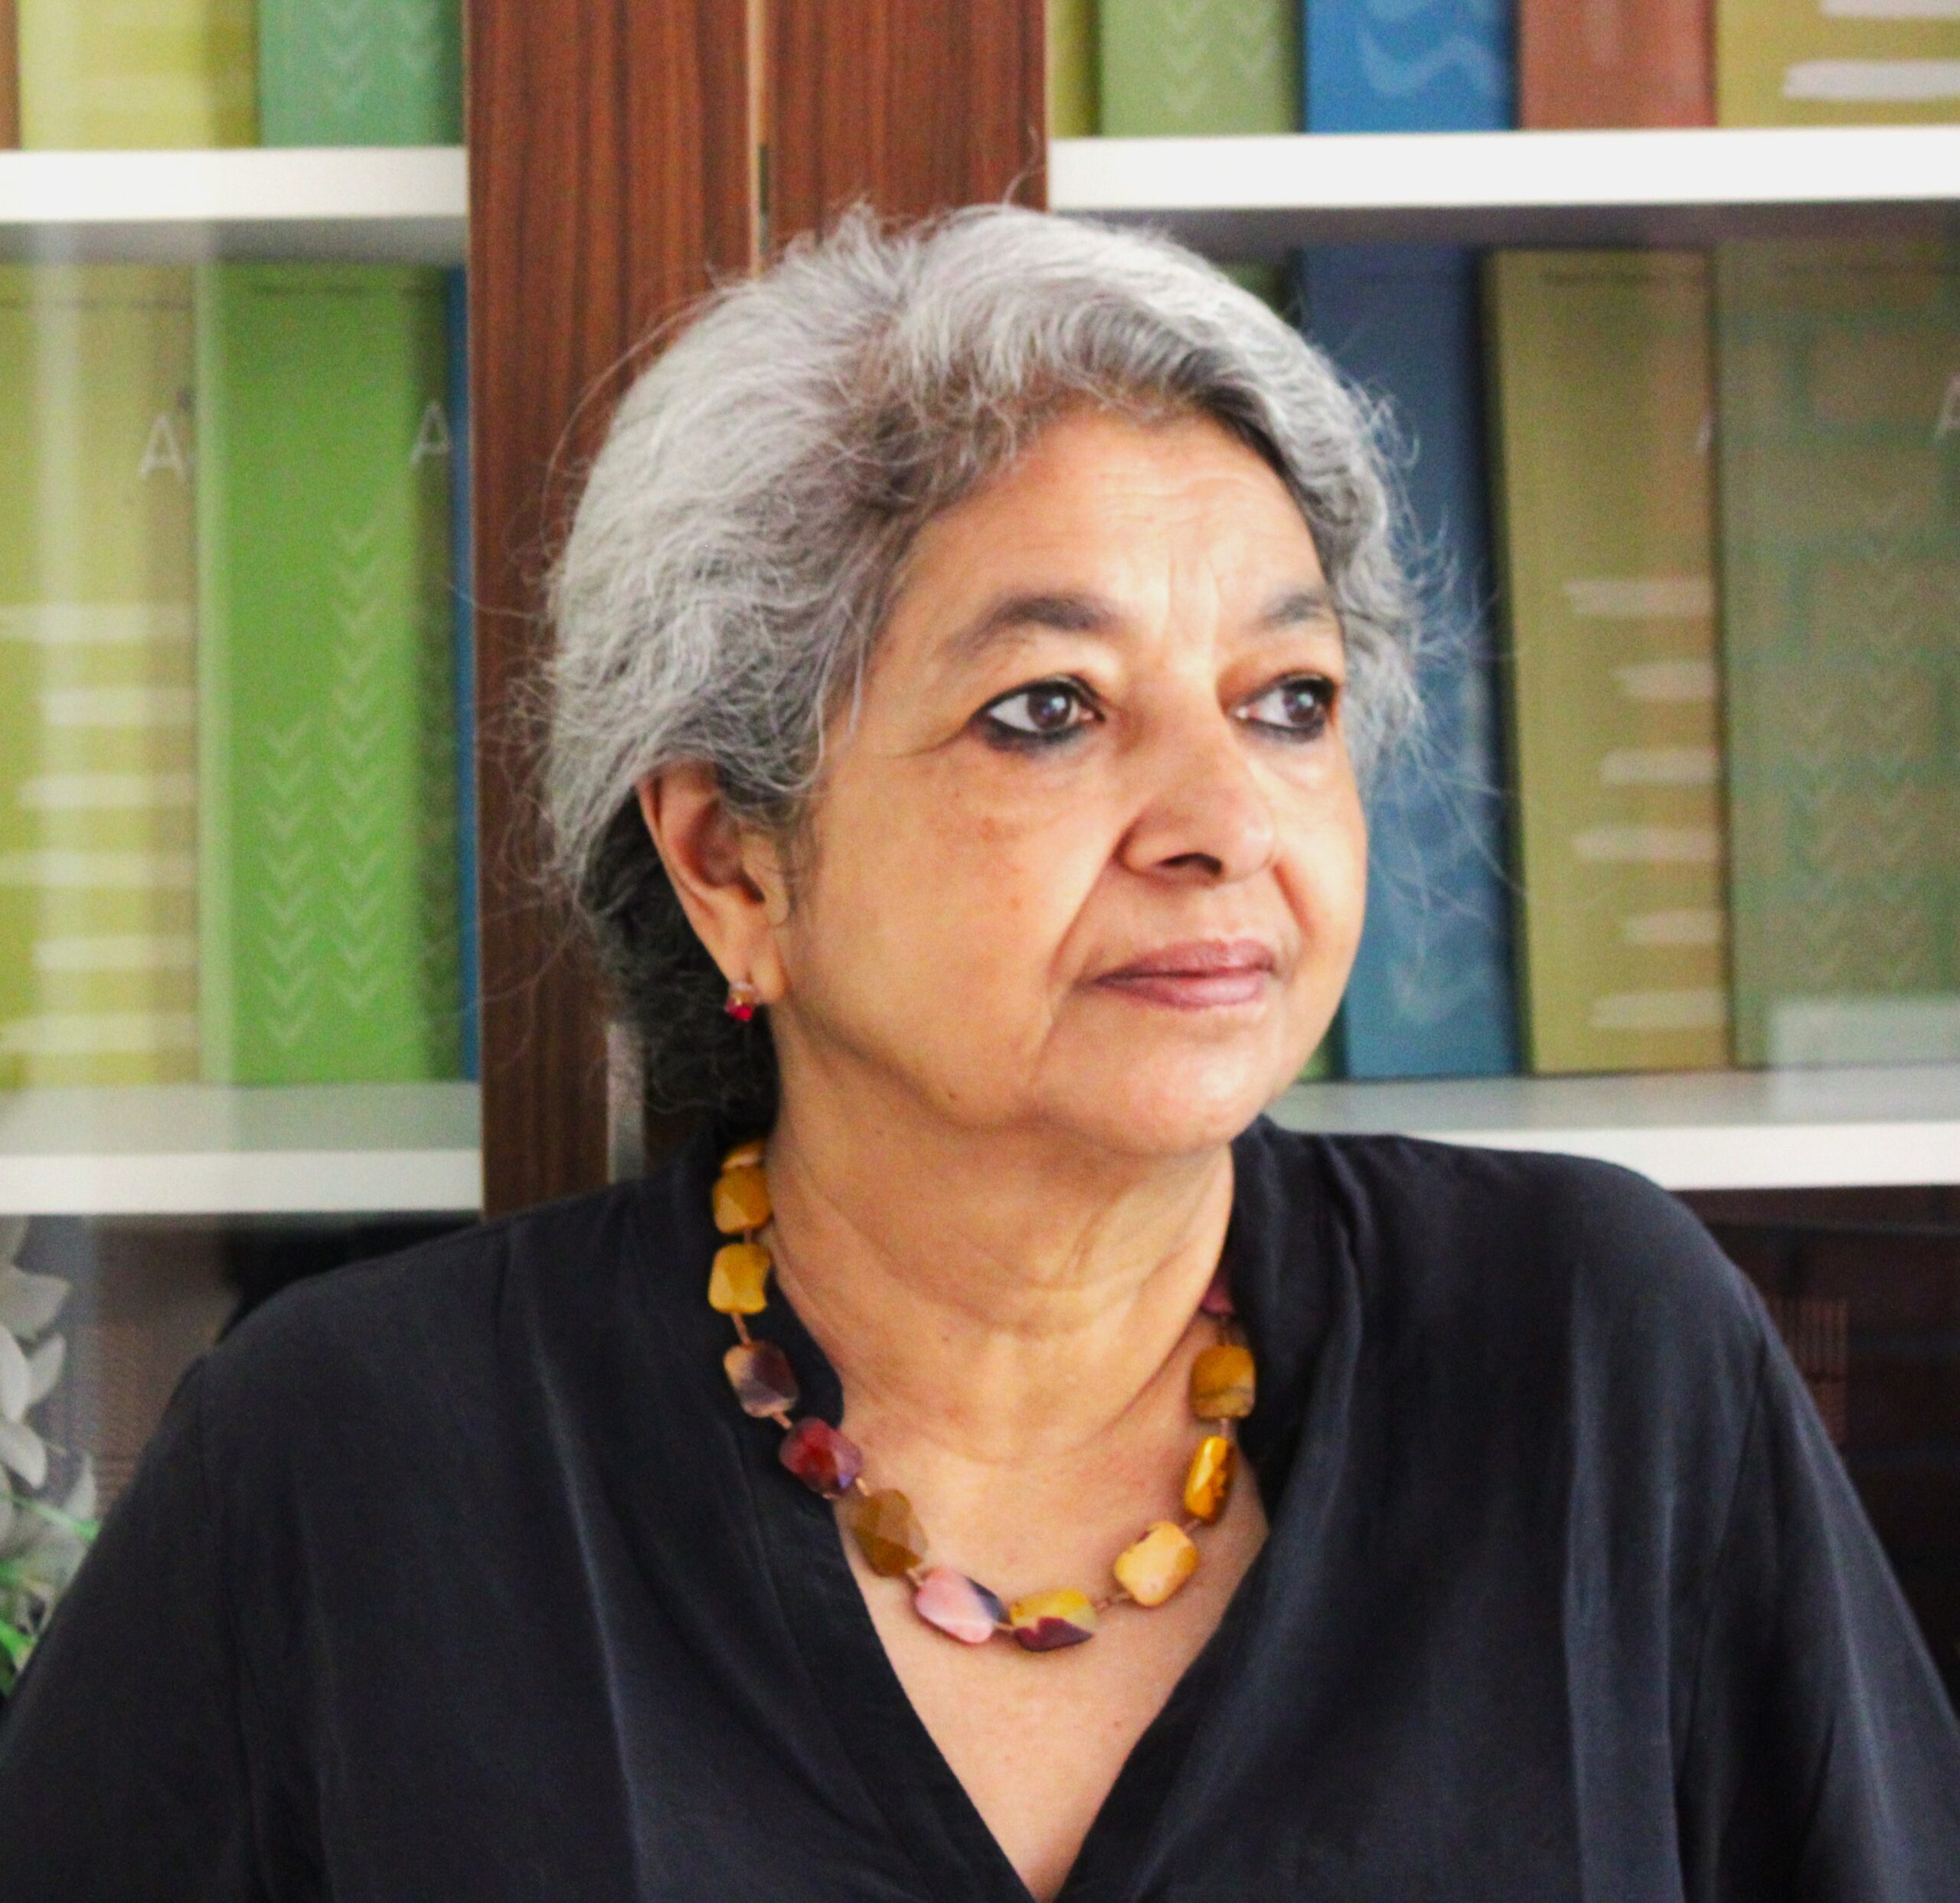
Madhura Swaminathan is Professor and Head, Economic Analysis Unit, Indian Statistical Institute Bangalore Centre. She is also a Trustee of the Foundation for Agrarian Studies.


 Sudha is an Administrative Assistant of the Foundation. She assists the administrative division of the Foundation and also has taken part in fieldwork organised by the Foundation.


