
Introduction
Chemical fertilizers are vital agricultural inputs alongside seeds and irrigation, and have played an important role in sustaining agricultural production in India. With limited scope for expanding area under cultivation, future growth in agricultural output depends on improving the productivity of land already under cultivation. Fertilizers can contribute significantly to increasing productivity by supplying essential nutrients for crops (Chand and Pavithra 2015). This makes it important to understand whether fertilizers are being used efficiently and in the right proportion.
In 2026, the Foundation for Agrarian Studies, Bengaluru, as part of its Project on Agrarian Relations in India (PARI), conducted primary surveys in Yendagandi and Panduvva villages in Undi mandal of West Godavari, Andhra Pradesh. A preliminary field observation revealed a contradictory picture. While the Government of Andhra Pradesh has been promoting natural farming through the Rythu Sadhikara Samstha (RySS) programme since 2016 and signboards in the village discourage the use of chemical fertilizers, farmers were found to be using different types of chemical fertilizers in their fields. This observation motivated the present district-level analysis, which showed that West Godavari occupies a distinctive position in the fertilizer landscape of the State and the country.
Any analysis of fertilizer consumption must take into account two aspects: the intensity of fertilizer nutrients applied and their composition. These dimensions are particularly important in the case of West Godavari, as the district combines a particularly high intensity of nutrient use with a nutrient composition that differs significantly from the State and national averages. This makes West Godavari an important case for examining the quantity and composition of nutrients applied. Understanding these patterns provides a useful starting point for assessing fertilizer use at both the farm and village levels in the region.
Fertilizer Products Used in India
Indian soils are deficient in major macro- and micronutrients (1) (Khurana et al. 2022), and it is essential to use different fertilizer products as per the nutrient requirements (of nitrogen (N), phosphorus (P), and potassium (K) and so on). The different types of fertilizers used by farmers in India can be broadly grouped into: straight nitrogenous fertilizers (with different amounts of nitrogen); straight phosphates (with different amounts of phosphorus); straight potassic fertilizers (with different amounts of potassium); and NP/NPK complex fertilizers (with different amounts of NPK). Types of fertilizers used and their grade are given in Table 1.
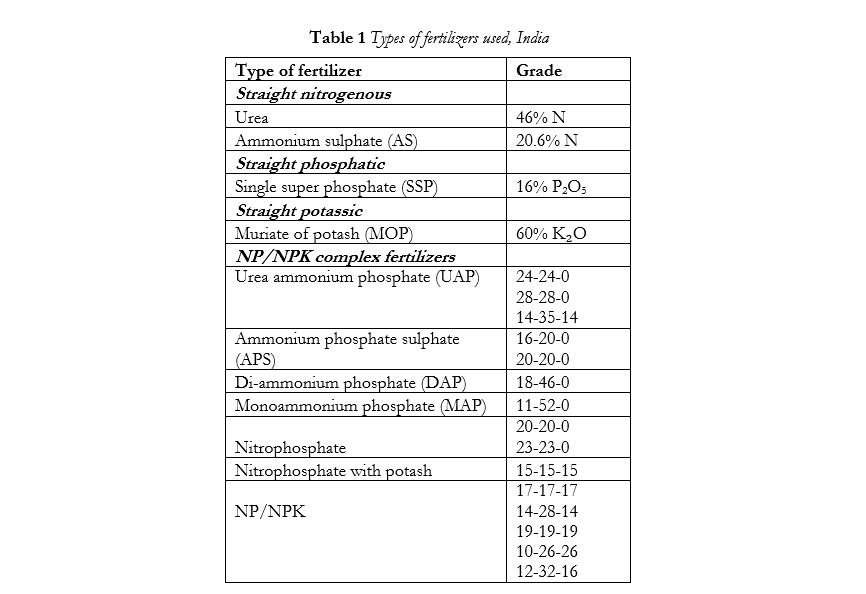
Note: The figures under “Grade” indicate the percentage of nutrients contained in the product. For example, 12-32-16 shows the share of N, P, and K in the product, i.e. 12 per cent nitrogen, 32 per cent phosphorus, and 16 per cent potassium.
Source: Department of Fertilizers, Ministry of Chemicals and Fertilizers, Government of India.
Among these, straight nitrogenous fertilizers are the most commonly used in India, followed by complex fertilizers and phosphatic fertilizers. According to the Fertiliser Association of India (FAI) (2024), straight nitrogenous fertilizers like urea and ammonium sulphate contribute around 57 per cent of the total fertilizer consumption; complex fertilizers like NP/NPK and DAP and the straight phosphatic fertilizer, SSP, contribute around 33.5 per cent and 6.6 per cent respectively; and the potassic fertilizer, MOP, contributes 2.9 per cent.
However, despite the widespread use of different fertilizer products, India’s aggregate nutrient-use intensity remains lower than that of other developing countries. In 2022, nutrient consumption per hectare of arable land and land under permanent crops was 177.6 kg per ha in India, compared to 407.4 kg per ha in Egypt, 350.4 kg per ha in China, 324.2 kg per ha in Bangladesh, and 294.4 kg per ha in Brazil (FAI 2024).
Andhra Pradesh in India’s Fertilizer Landscape
Fertilizer intensity in Andhra Pradesh is the highest among major Indian States. According to FAI (2024), the nutrient consumption per hectare of gross cropped area in Andhra Pradesh was 255 kg, which is almost 1.8 times higher than the national average of 139.7 kg (see Figure 1). The State’s high fertilizer intensity is also evident from its share in fertilizer nutrient consumption at the national level. Andhra Pradesh accounts for only 3.1 per cent of India’s gross cropped area, but accounts for 5.6 per cent of total nutrient consumption.
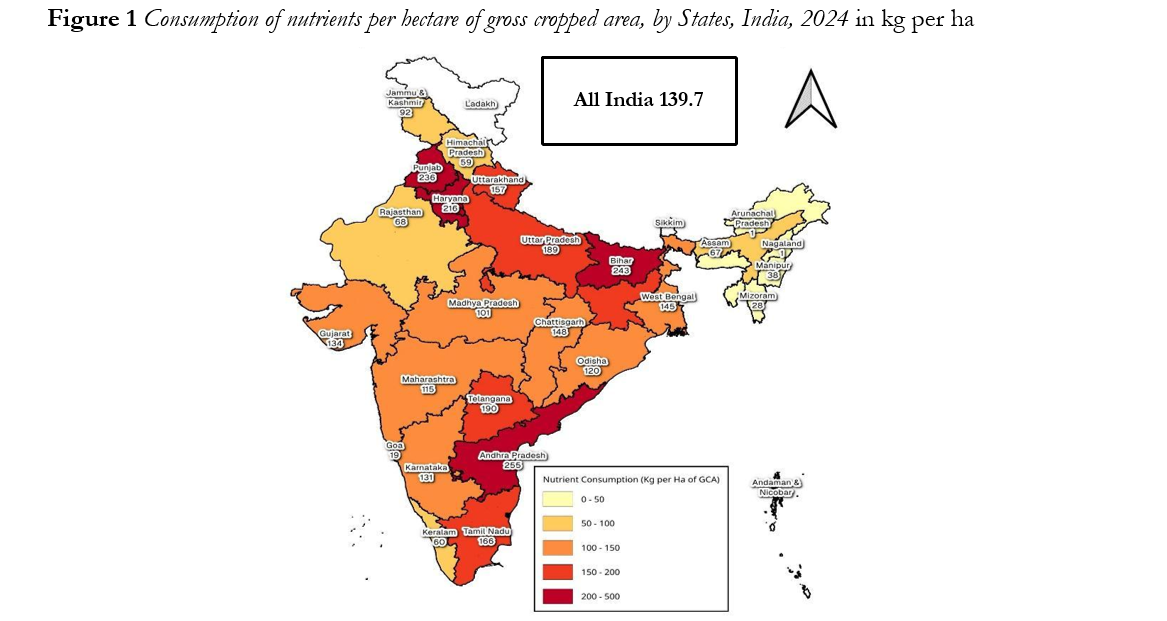
Source: Fertiliser Statistics, 2024.
The district-level consumption pattern further shows Andhra Pradesh’s importance in India’s fertilizer landscape. Three of the top five districts in India are from the State: Kurnool ranked first, with a consumption of 225,184 tonnes; Guntur ranked second, with 217,436 tonnes; and West Godavari ranked fifth, with 191,392 tonnes. Together, Kurnool, Guntur, and West Godavari accounted for 634,012 tonnes of NPK consumption, which is 61.4 per cent of the combined consumption of the five highest-consuming districts. West Godavari stood out from other districts in terms of nutrient use intensity. The district recorded fertilizer consumption of 996.2 kg per ha, considerably higher than the levels recorded in Kurnool and Guntur, at 408.8 kg per ha and 457 kg per ha, respectively.
West Godavari: An Exceptional Case of Fertilizer Nutrient Intensity
The district-wise analysis reveals West Godavari stands out in both the amount of fertilizer nutrients used and the intensity. The district consumed about 100,555 tonnes of nitrogen, 58,781 tonnes of phosphorus, and 32,055 tonnes of potassium, taking total nutrient consumption to 191,392 tonnes in 2023–24. The district’s per hectare nutrients use is almost 3.9 times the average of Andhra Pradesh. As noted earlier, West Godavari’s fertilizer nutrient intensity is much higher than other districts in the State as well as in the country.
Across Andhra Pradesh, total fertilizer consumption was approximately 1.03 million tonnes of nitrogen, 0.53 million tonnes of phosphorus, and 0.16 million tonnes of potassium, corresponding to an aggregate NPK ratio of about 6.6:3.4:1. Of the total nutrients consumed, nitrogen accounted for around 59.9 per cent, phosphorus for 31 per cent, and potassium for only 9 per cent. In contrast, West Godavari shows a different pattern. The district recorded an NPK ratio of 3.14:1.83:1, with nitrogen accounting for 52.5 per cent, phosphorus for 30.7 per cent, and potassium for 16.7 per cent of the total nutrient consumption.
The interesting point about West Godavari is not just the intensity of the nutrients used, but also its nutrient composition. Its nutrient-use pattern differs from the State average. The difference is more evident in the case of potassium. West Godavari accounted for about 9.7 per cent of Andhra Pradesh’s total nitrogen consumption and 11 per cent of its phosphorus consumption, but its share of the State’s potassium consumption was much higher, at around 20.6 per cent. As potassium accounts for a considerably larger share of the nutrients consumed in the district, its overall nutrient composition is different from the pattern seen in Andhra Pradesh (See Table 2).
Nutrient Composition and Benchmark Ratios
It is important to know the prices at which various fertilizers are sold to farmers for a better understanding of nutrient composition. Fertilizers are classified as essential commodities under the Essential Commodities Act, 1955. Their quality, pricing, and sale are regulated through the Fertilizer (Control) Order (FCO) of 1957, revised in 1985. The Government has intervened extensively in the fertilizer market through subsidy policies to ensure availability to farmers at affordable prices. However, with the economic reforms of the 1990s, there has been an effort to contain the fertilizer subsidy burden by partially deregulating the sector. While urea remained under government price control, non-urea fertilisers were decontrolled. This led to a significant increase in the prices of non-urea fertilisers, which are important sources of phosphorus and potassium, making them relatively more expensive for farmers.
The impact of the shift in fertilizer subsidy policies is reflected in the maximum retail prices (MRPs) of various fertilizer products. In 1991, the MRP per tonne of urea was Rs 3,060, and that of DAP and NPK (10-26-26) complexes were Rs 4,680 and Rs 3,840, respectively. In 2010, the rates had increased to Rs 5,310, Rs 9,350, and Rs 7,197 for urea, DAP, and NPK complexes. Table 2 gives the prices for November, 2025. A comparison of different fertilizer products over the years shows that the prices of urea remained substantially lower than those of other fertilizer products, and the price gap has widened over the years.
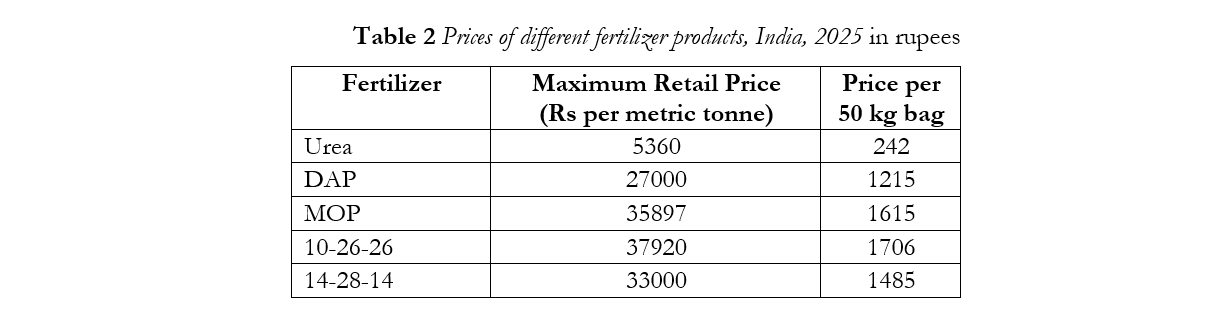
Note: Urea is sold in 45-kg bags.
Source: Monthly Bulletin, November, 2025, Department of Fertilizers, Ministry of Chemicals and Fertilizers, Government of India.
Given the price difference between urea and non-urea products, farmers are prompted, especially those with low economic status, to use more urea and substitute it for other phosphatic and potassic fertilizers. This can deteriorate the nutrient ratio, making it highly skewed towards nitrogen, as urea has high nitrogen content. This can be seen from the NPK ratio of India, which deteriorated from 5.9:2.4:1 in 1991–92 to 10.9:4.4:1 in 2023–24. The disparity across different zones in India is also very significant, with the ratio being 6.2:2.6:1 in the east, 30.7:8.7:1 in the north, 6.5:3.1:1 in the south, and 11.6:5.6:1 in the west.
The composition of fertilizer nutrients used has been an important issue in discussions of fertilizer use in India. The popular and widely accepted ratio of 4:2:1 for NPK was considered the balanced nutrient ratio. However, this ratio emerged from field trials conducted in the 1950s for two crops before the Green Revolution. Addressing the drawbacks of that ratio, Chand and Pavithra (2015) estimated a “normative” NPK ratio at national and state levels based on area under various crops and the recommended dose of these nutrients for respective crops, as per the “Package of Practices” developed by state agricultural universities and Indian Council of Agricultural Research (ICAR) institutes. Their analysis estimated a normative ratio of 2.6:1.4:1 for India and 2.4:1.43:1 for Andhra Pradesh.
To assess balance in fertilizer consumption across Andhra Pradesh, the NPK ratios of seven districts with the highest fertilizer consumption in 2023–24 were compared with three reference ratios: 4:2:1 (the widely accepted balanced ratio, as mentioned), 2.6:1.4:1 (of India), and 2.4:1.43:1 (of Andhra Pradesh). For the analysis, the Euclidean distance of the actual ratio from the benchmark NPK ratios was used (Agarwal et al. 2024). A Euclidean distance of zero indicates an exact match between the actual ratio and the benchmark ratio. A larger distance indicates a greater deviation from the benchmark.
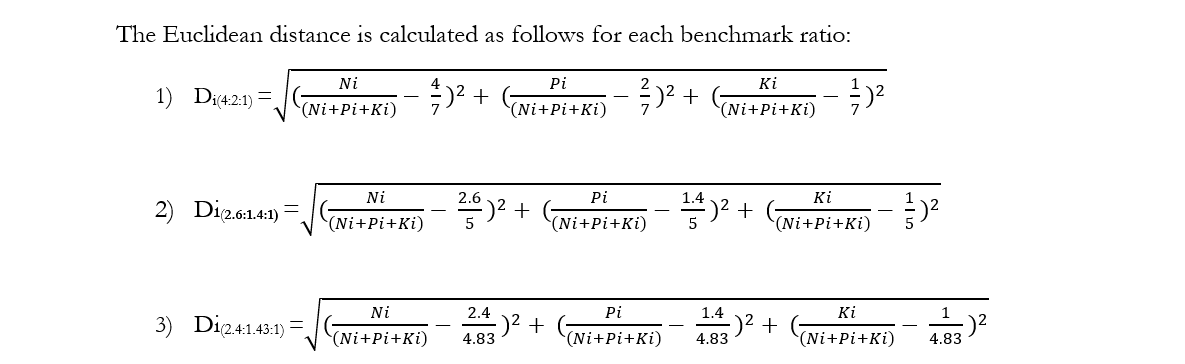
where:
Dᵢ = Euclidean distance of district i from the benchmark NPK ratio.
Nᵢ = Nitrogen consumption in district i
Pᵢ = Phosphorus consumption in district i
Kᵢ = Potassium consumption in district i
Nᵢ + Pᵢ + Kᵢ = total consumption of N, P, and K in district i
4/7, 2/7, and 1/7 are the normalised nutrient shares corresponding to the benchmark ratio 4:2:1 in the first equation. Similarly, other benchmark ratios were also normalised in equations 2 and 3.
The analysis shows that West Godavari’s actual NPK ratio is relatively close to the reference ratios considered. The district recorded distances of approximately 0.055 from the 4:2:1 ratio, 0.043 from the 2.6:1.4:1 ratio, and 0.050 from the 2.4:1.43:1 ratio (See Table 3). These were among the lowest deviations recorded across the highest fertilizer-consuming districts in Andhra Pradesh. It implies that, despite its exceptionally high fertilizer intensity, the district’s aggregate nutrient composition is relatively more balanced than that of other districts in the State. This pattern also reveals that farmers use different types of fertilizer products rather than relying on one product alone, even though there is considerable price difference among the products.
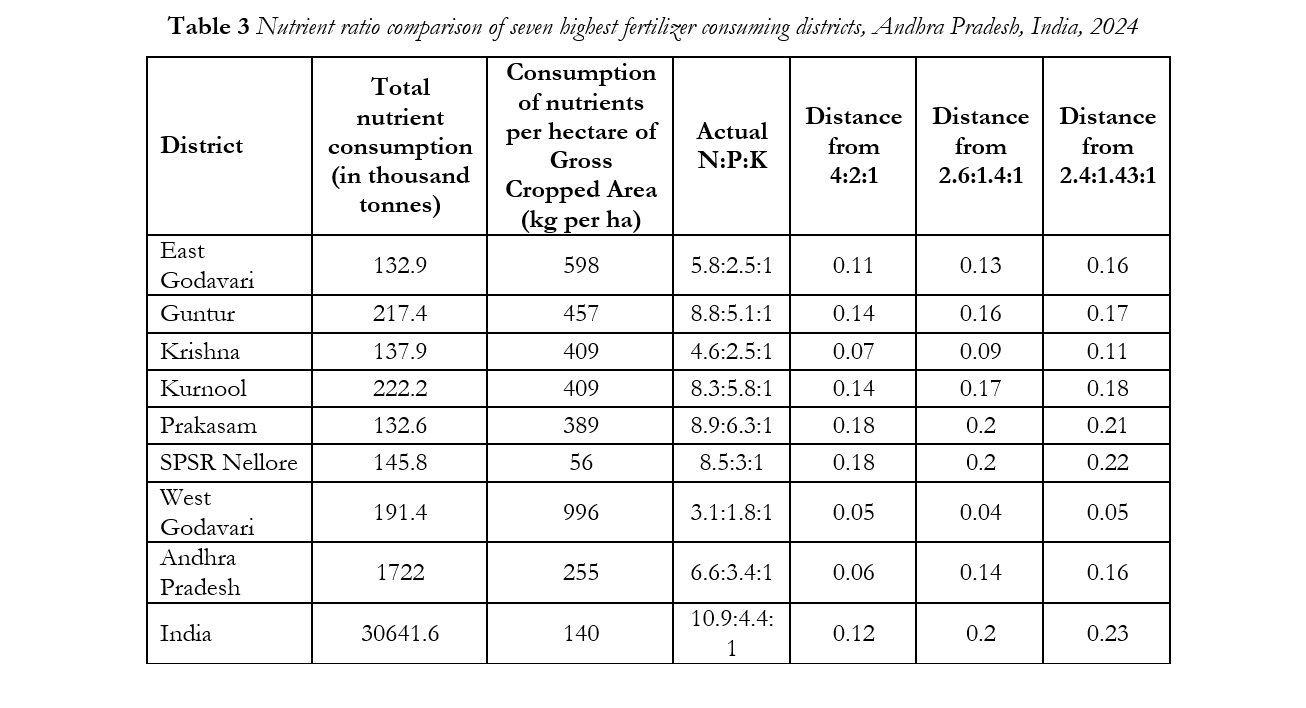 Note: See Appendix for Euclidean distance of all districts.
Source: Computed using data from Fertiliser Statistics, 2024.
Conclusion
Andhra Pradesh occupies an important place in India’s fertilizer landscape. Its per hectare fertilizer nutrient consumption is well above the national average, and it is home to several of the country’s highest-consuming districts. Within this context, West Godavari presents a distinct case. In 2023–24, the district consumed 191,392 tonnes of NPK, and the fertilizer nutrient intensity reached 996.2 kg per ha, almost four times higher than the State average. In addition, the district’s NPK ratio of 3.14:1.83:1 differed from the State ratio of 6.62:3.42:1, mainly due to the relatively higher consumption of potassium. The nutrient composition of the district is also relatively well balanced compared to the benchmark ratios used in this analysis.
The district-level pattern raises pertinent questions about what drives the high intensity and composition of fertilizer use in West Godavari. However, the aggregate data do not show how fertilizer use varies across crops and farms, or how factors such as crop choice, cropping pattern, irrigation, farm size, and input-use practices influence the application of different fertilizers. Analysis of the data collected through the PARI survey, such as different types of fertilizers used, the prices paid for each product, crop-wise and season-wise fertilizer quantities applied across different socio-economic classes, and so on, would provide an opportunity to examine fertilizer-use practices at the village and farm levels and could complement the district-level evidence by showing how broader patterns are reflected in the farming practices in the surveyed villages.
Acknowledgements: I thank Arindam Das, Sandipan Baksi, Sai Chandan Kotu, and C. A. Sethu for their assistance in preparing this manuscript. I also thank Nikita Gupta and Rebecca Rose Varghese for editing the manuscript.
Notes
(1) All crops need six essential macronutrients, namely nitrogen, phosphorus, potassium, sulphur, calcium, and magnesium in relatively large amounts, whereas micronutrients such as boron, iron, manganese, copper, zinc, molybdenum, and chlorine are required in smaller quantities (Roy et al. 2006).
References
(1) Agarwal, S., Desai, M., Ghosh, P., and Vats, N. (2025), “Bridging the Information Gap: Sowing the Seeds of Productivity with High-speed 4G Internet,” Paper presented at the Allied Social Science Associations (ASSA) annual meeting, American Economic Association, San Francisco, January 3–5, available at https://www.aeaweb.org/conference/2025/program/paper/A3N4SQ6Y.
(2) Chand, R., and Pavithra, S. (2015), “Fertiliser Use and Imbalance in India: Analysis of States,” Economic and Political Weekly, vol. 50, no. 44, pp. 98–104.
(3) Fertiliser Association of India (FAI) (2024), “Fertiliser Statistics 2023-24,” 69th edition, FAI, New Delhi.
(4) Khurana, A., and Kumar, V. (2022), “State of Biofertilizers and Organic Fertilizers in India,” Centre for Science and Environment.
(5) Roy, R. N., Finck, A., Blair, G. J., and Tandon, H. L. S. (2006), “Plant Nutrition for Food Security: A Guide for Integrated Nutrient Management,” Food and Agriculture Organization (FAO) Fertilizer and Plant Nutrition Bulletin 16, FAO, United Nations.
Appendix
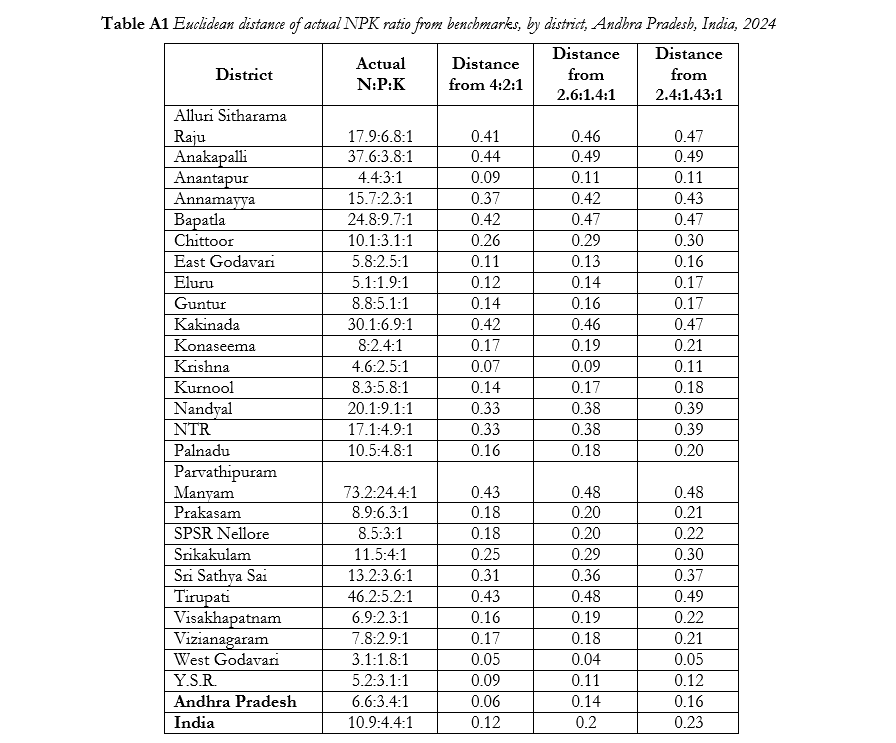
Source: Computed using data from Fertiliser Statistics, 2024.